What should you consider when choosing a CRM system?
How can a CRM system be effectively expanded?
What does a GDPR-compliant CRM need to do?
About Gedys
35+ Years CXM/CRM Practice
Sustainability
Careers and Jobs
Gedys Dashboards and Reports
Successful steering. Share facts. With Dashboards and Reports.
Create, manage and distribute dashboards and reports across platforms and devices - for interactive business intelligence and successful corporate management.
Gedys Dashboards and Reports software takes the pressure off both your development and IT teams by enabling users to create and manage analyses and reports directly.
Time-consuming designs are a thing of the past. Drag and drop to create professional, interactive dashboards and reports without having to write a single line of code.
Recognizing trends, filtering data and using drill-downs - each element immediately provides new insights.
Without programming
Drag & drop instead of complex design: Create interactive dashboards and reports professionally - without any code.
User-friendly
Intuitive interface and flexible runtimes allow every user to create personalized dashboards and reports.
Any data source. At any time.
No matter how complex your data is, the selection and use of suitable data sources is effortless.
Our customers' success stories from over 35 years of CRM practice
Save the brochure and read it later
Create, manage and distribute static reports and interactive business intelligence dashboards to successfully manage your business.
Create vivid dashboards
From any data source. At any time.
The goal is simple: to provide business users with all the information they need to make decisions in real time. While traditional reports remain rigid, Gedys Dashboards & Reports offers an intuitive interface and flexible runtimes. This allows each user to personalize evaluations, identify trends with drill-down and filter data interactively - for instant insights by data series, values and parameters.
Dashboard Designer
Your powerful assistant: Define data sources once and then drag & drop all the desired fields onto your dashboard.
Sales targets
Your dashboards in Gedys show you your sales figures with just a few clicks. In the form of graphs, pie charts, bar charts or easy-to-understand figures - including data from other sources.
×
Your dashboards in Gedys show you your sales figures with just a few clicks. In the form of graphs, pie charts, bar charts or easy-to-understand figures - including data from other sources.
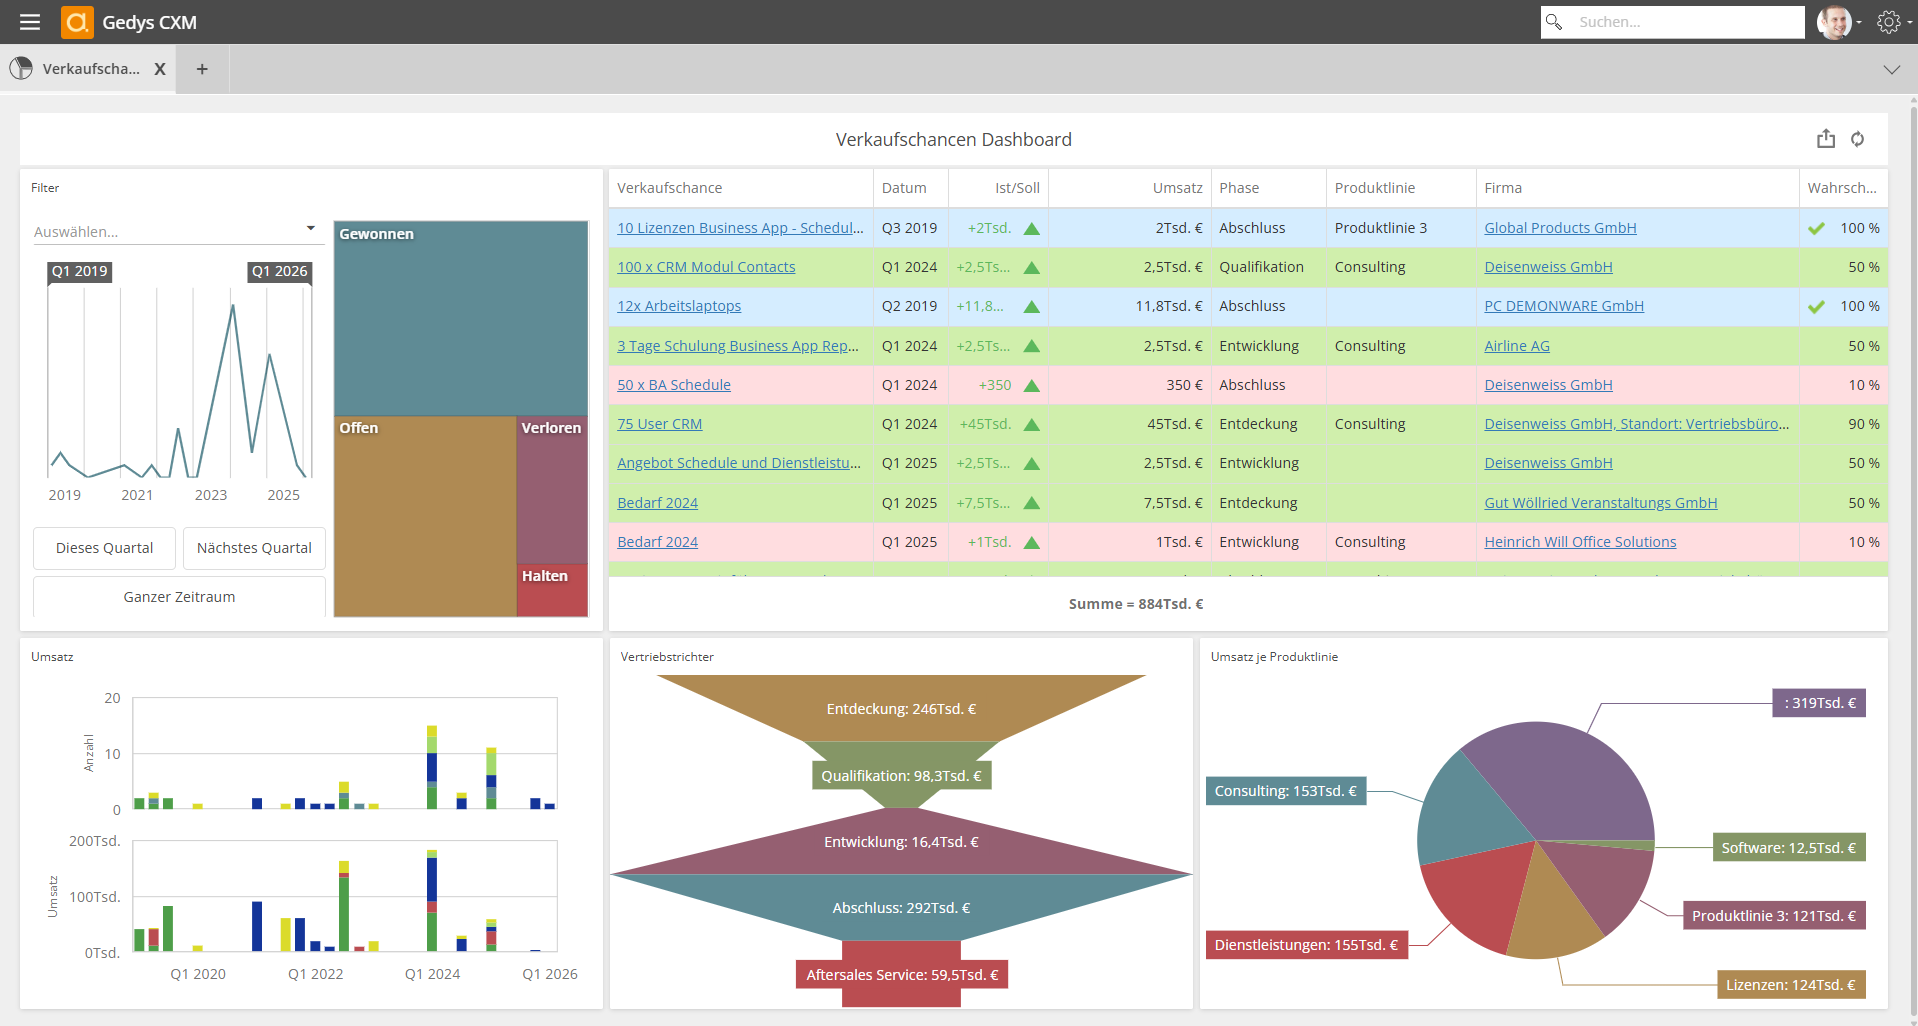
Sales opportunities
With well-maintained sales opportunities, you receive a meaningful forecast and can check your planning at any time. You can evaluate potential and sales and identify bottlenecks in the sales process at an early stage. Dashboards including sales funnels and reports keep you up to date.
×
With well-maintained sales opportunities, you receive a meaningful forecast and can check your planning at any time. You can evaluate potential and sales and identify bottlenecks in the sales process at an early stage. Dashboards including sales funnels and reports keep you up to date.
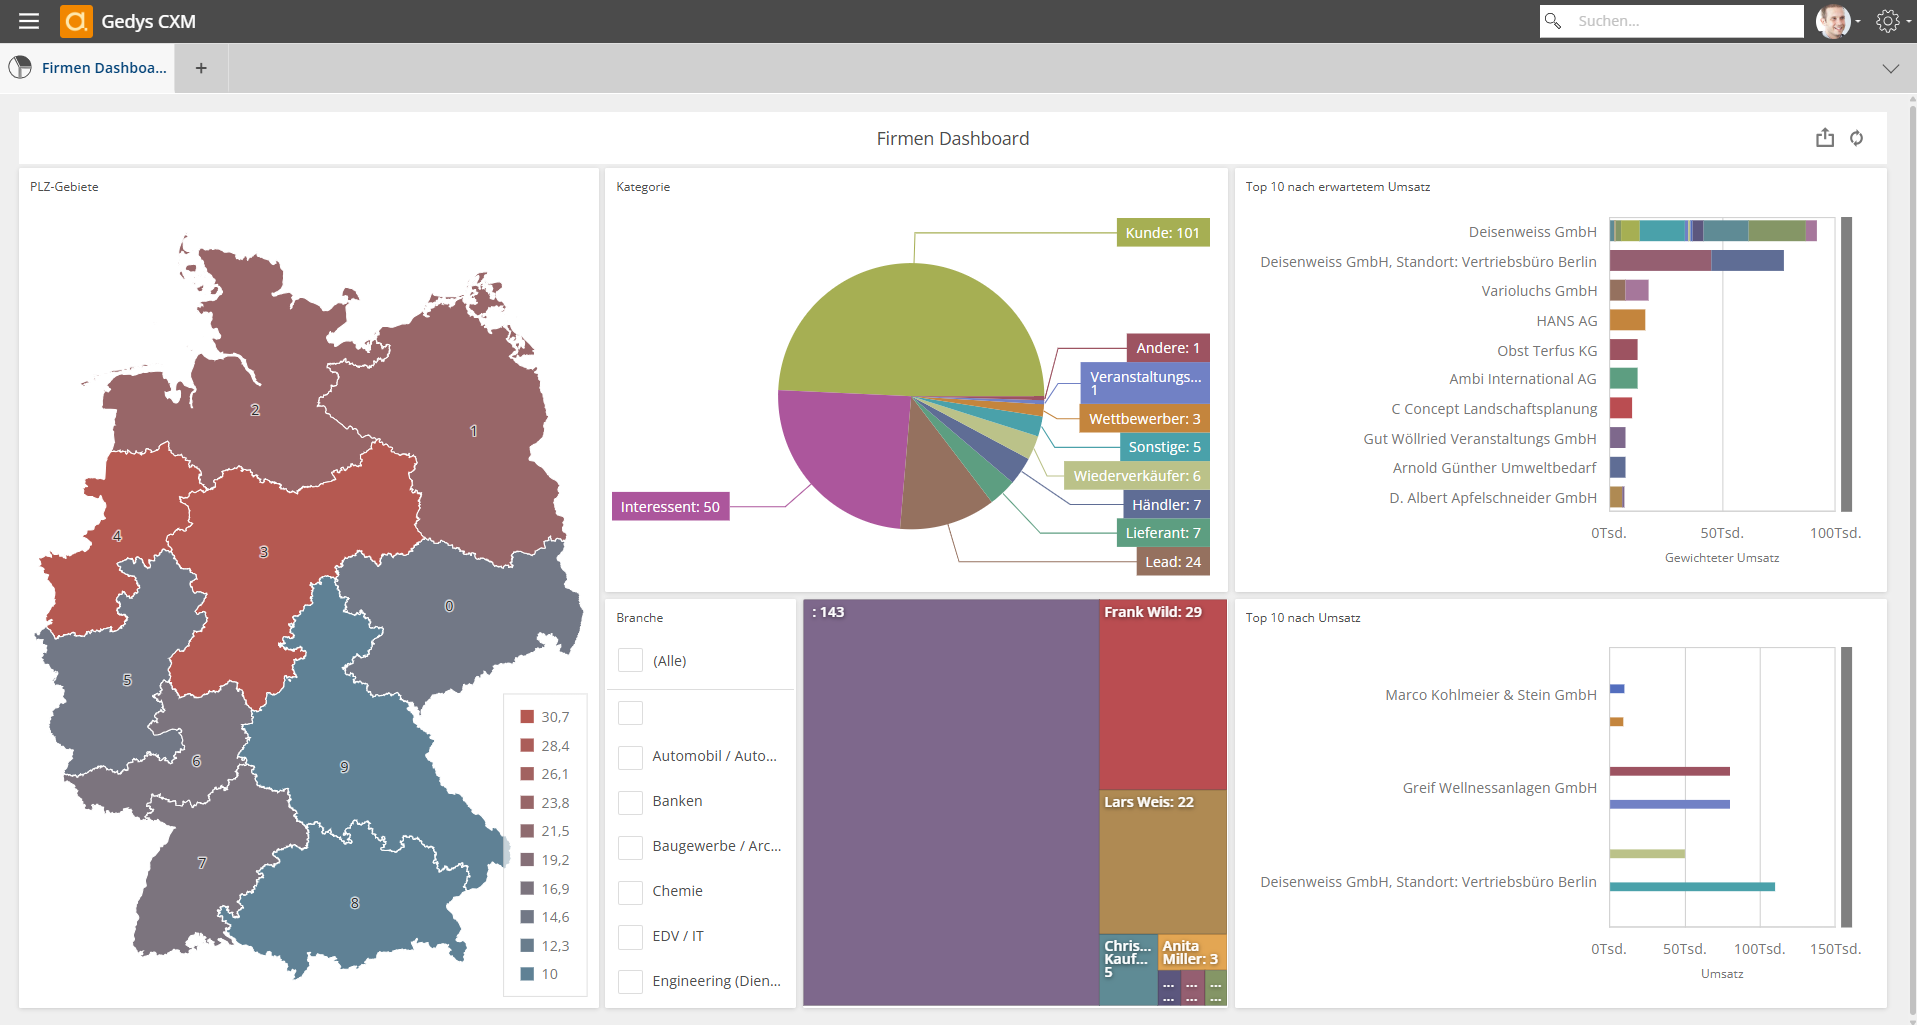
Companies and contacts
Immerse yourself. Identify trends with drill-down and data filtering. Each element can instantly provide additional insights into your customer data - by data series, values and parameters.
×
Immerse yourself. Identify trends with drill-down and data filtering. Each element can instantly provide additional insights into your customer data - by data series, values and parameters.
Your dashboards in Gedys show you your sales figures with just a few clicks. In the form of graphs, pie charts, bar charts or easy-to-understand figures - including data from other sources.
×
Your dashboards in Gedys show you your sales figures with just a few clicks. In the form of graphs, pie charts, bar charts or easy-to-understand figures - including data from other sources.
With well-maintained sales opportunities, you receive a meaningful forecast and can check your planning at any time. You can evaluate potential and sales and identify bottlenecks in the sales process at an early stage. Dashboards including sales funnels and reports keep you up to date.
×
With well-maintained sales opportunities, you receive a meaningful forecast and can check your planning at any time. You can evaluate potential and sales and identify bottlenecks in the sales process at an early stage. Dashboards including sales funnels and reports keep you up to date.
Immerse yourself. Identify trends with drill-down and data filtering. Each element can instantly provide additional insights into your customer data - by data series, values and parameters.
×
Immerse yourself. Identify trends with drill-down and data filtering. Each element can instantly provide additional insights into your customer data - by data series, values and parameters.
Intelligent reports for quick decisions
Merge, export and send data
Create, design and deliver reports
✓Set up reports and check them in a preview
✓Provide reports directly in your application
✓As required: Users can edit reports, upload images or provide signatures in the print preview
Merge data from different sources
✓Embed multiple PDF and DOCX documents simultaneously
✓Display complete reports in the integrated document viewer
✓All information clearly and centrally available
System requirements for dashboards and reports
Microsoft Server from 2016
Microsoft IIS as a free component of MS Server 2016
MySQL or Microsoft SQL 2016
Our recommendation for better performance: Due to the high computing power for the SQL Server, use a dedicated server with local SSDs
Current version of Google Chrome, Firefox, Microsoft Edge Chromium Please note: Single sign-on currently only from Microsoft Edge Chromium.